SmartTrace
See the structure. Then decide.
Candles record price, but they do not explain why it moved. SmartTrace connects to US options market source data and presents structure in institutional terms, so you read the market from that vantage.
Why structure matters
See the levels first. Then judge.
Candles record the move. They do not mark hedging pressure.
Rallies, ranges, and reversals often land near prices where dealers rehedge. Candle patterns do not mark these levels.
Nodes and walls — key levels in clear view
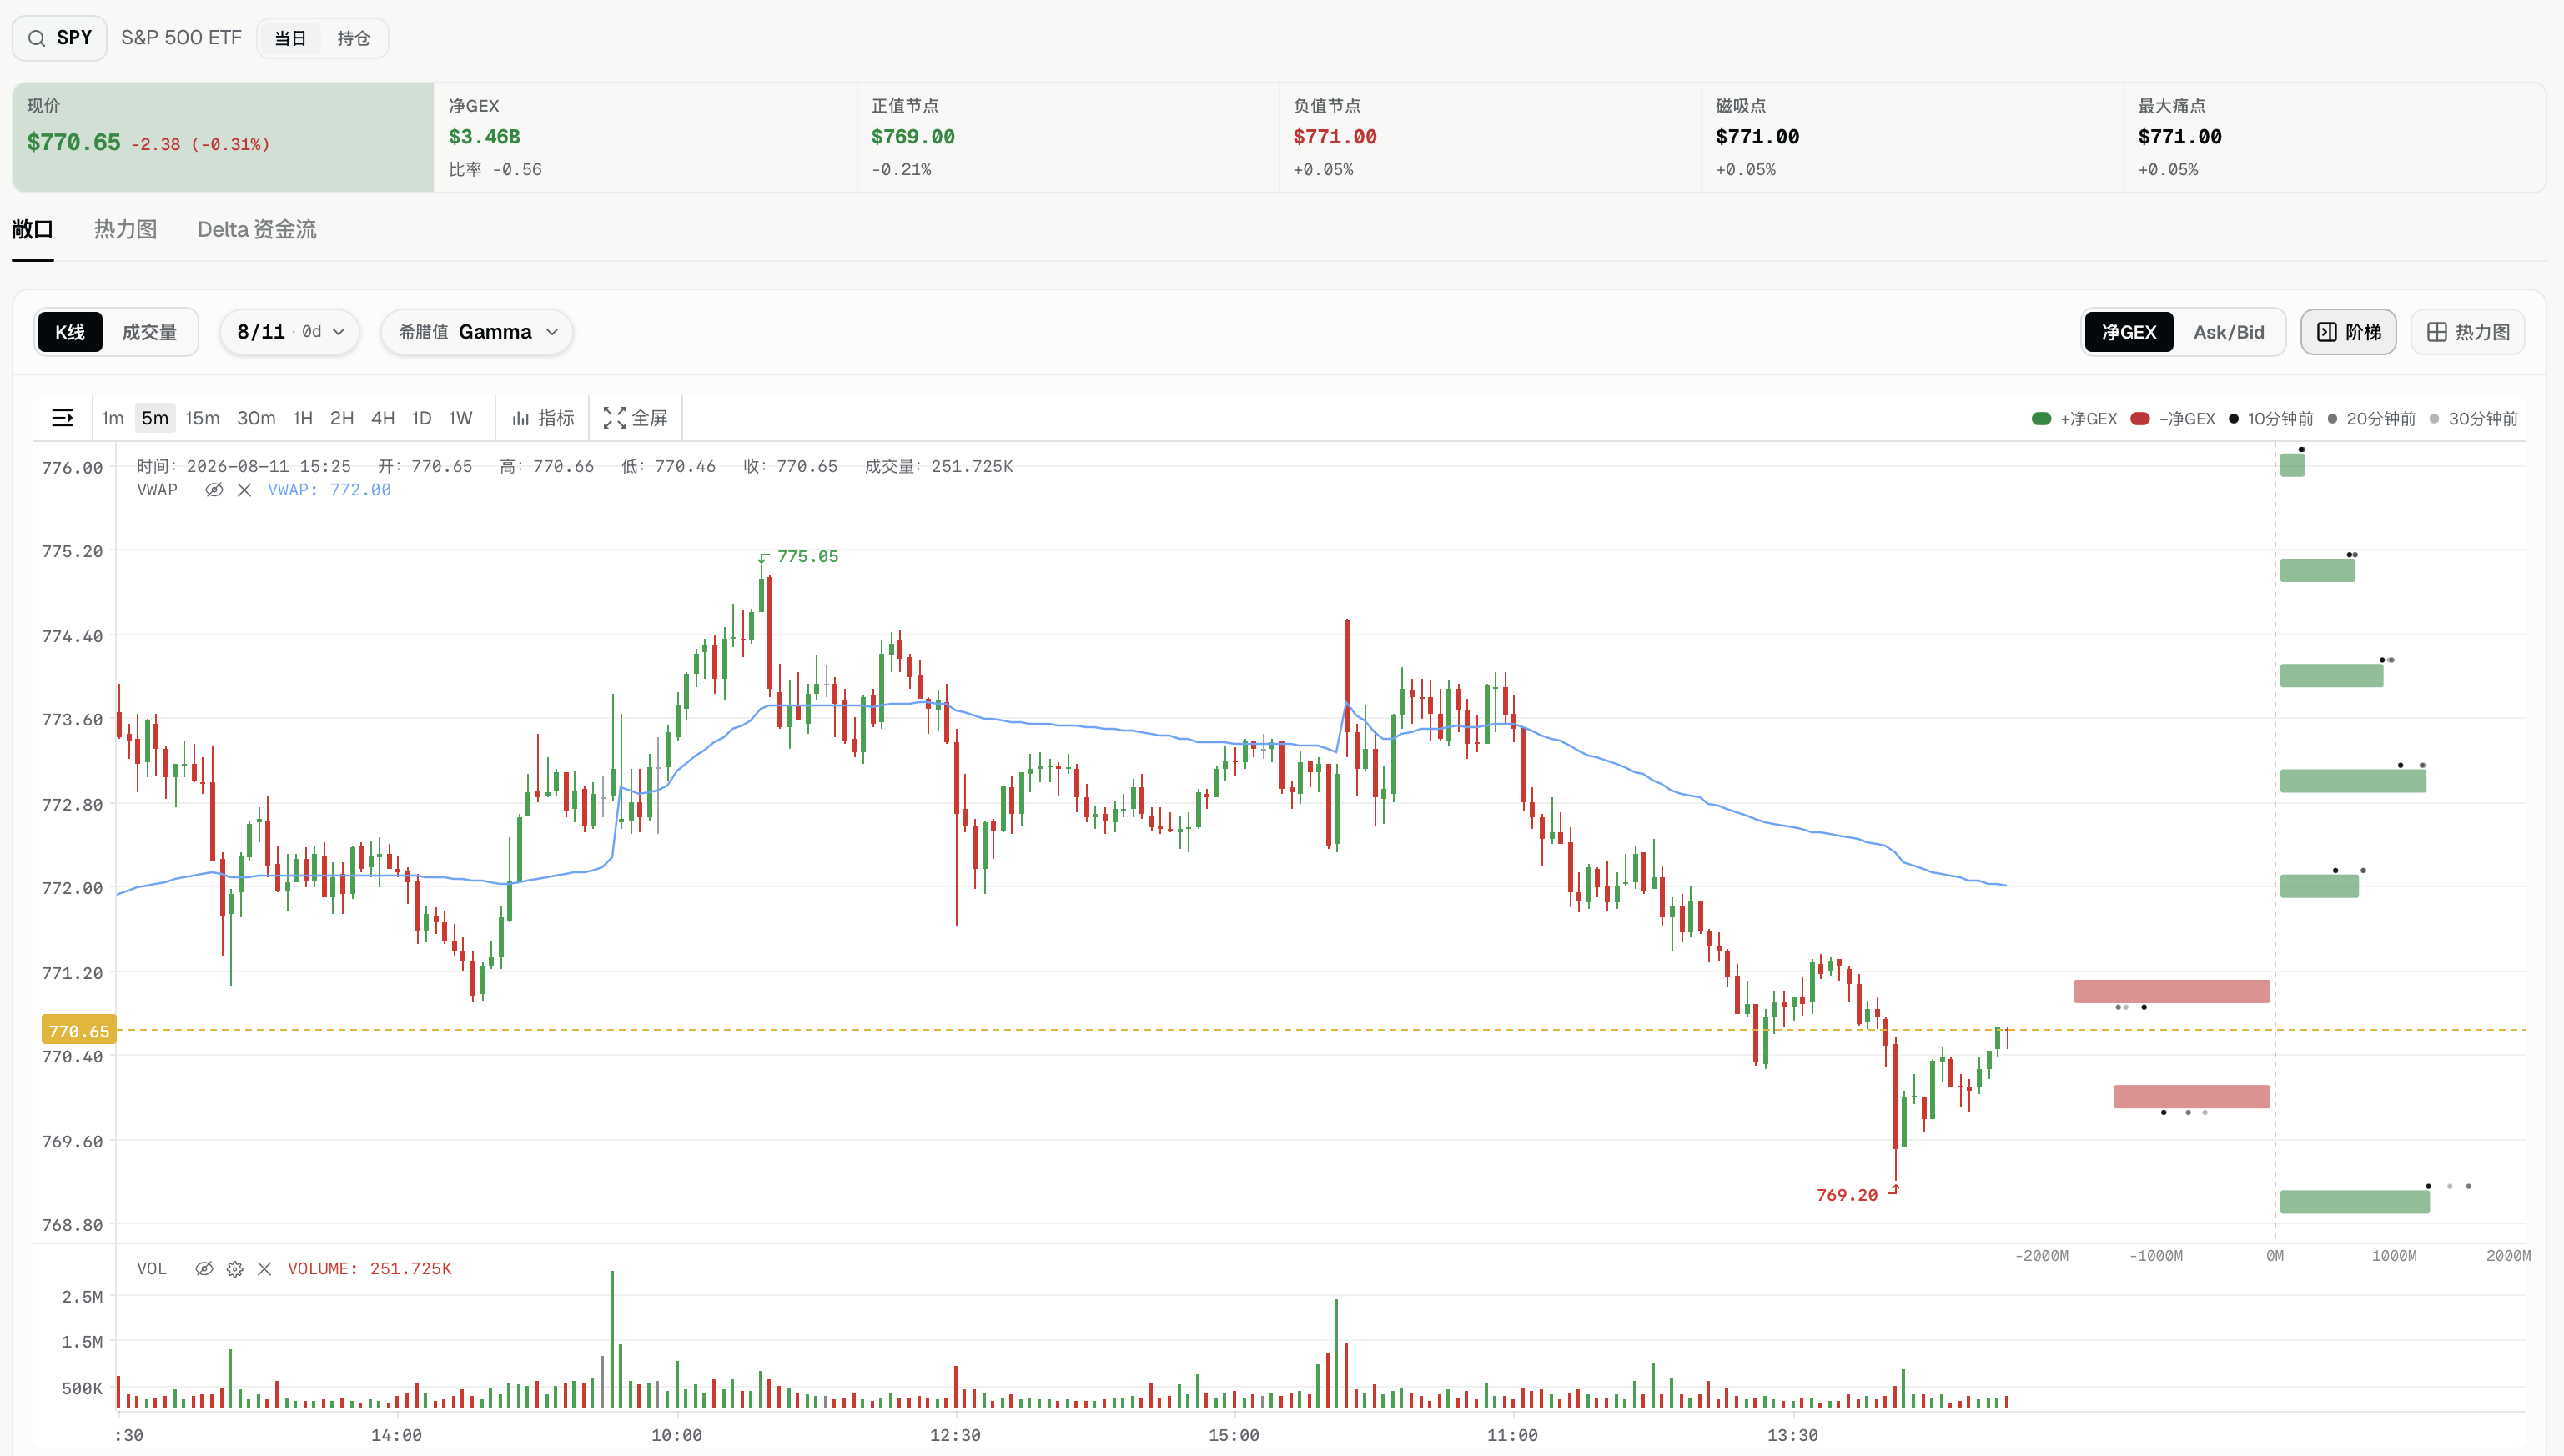
Intraday pos / neg nodes and OI call / put walls, marked on the chart. Darker color and taller bars mean denser hedging pressure.
One ticker, several reads
Dealer board for levels, Market Tide for session temperature; flow, dark pool, and smart money to assist judgment.
Dealer Board
Key levels, marked early
Nodes, walls, magnet, and max pain
Dealer exposure
Today: positive / negative nodes, magnet, max pain. OI: Call / Put walls and Gamma Flip.
- Key levels by Intraday / OI mode
- Side ladder or heatmap overlay
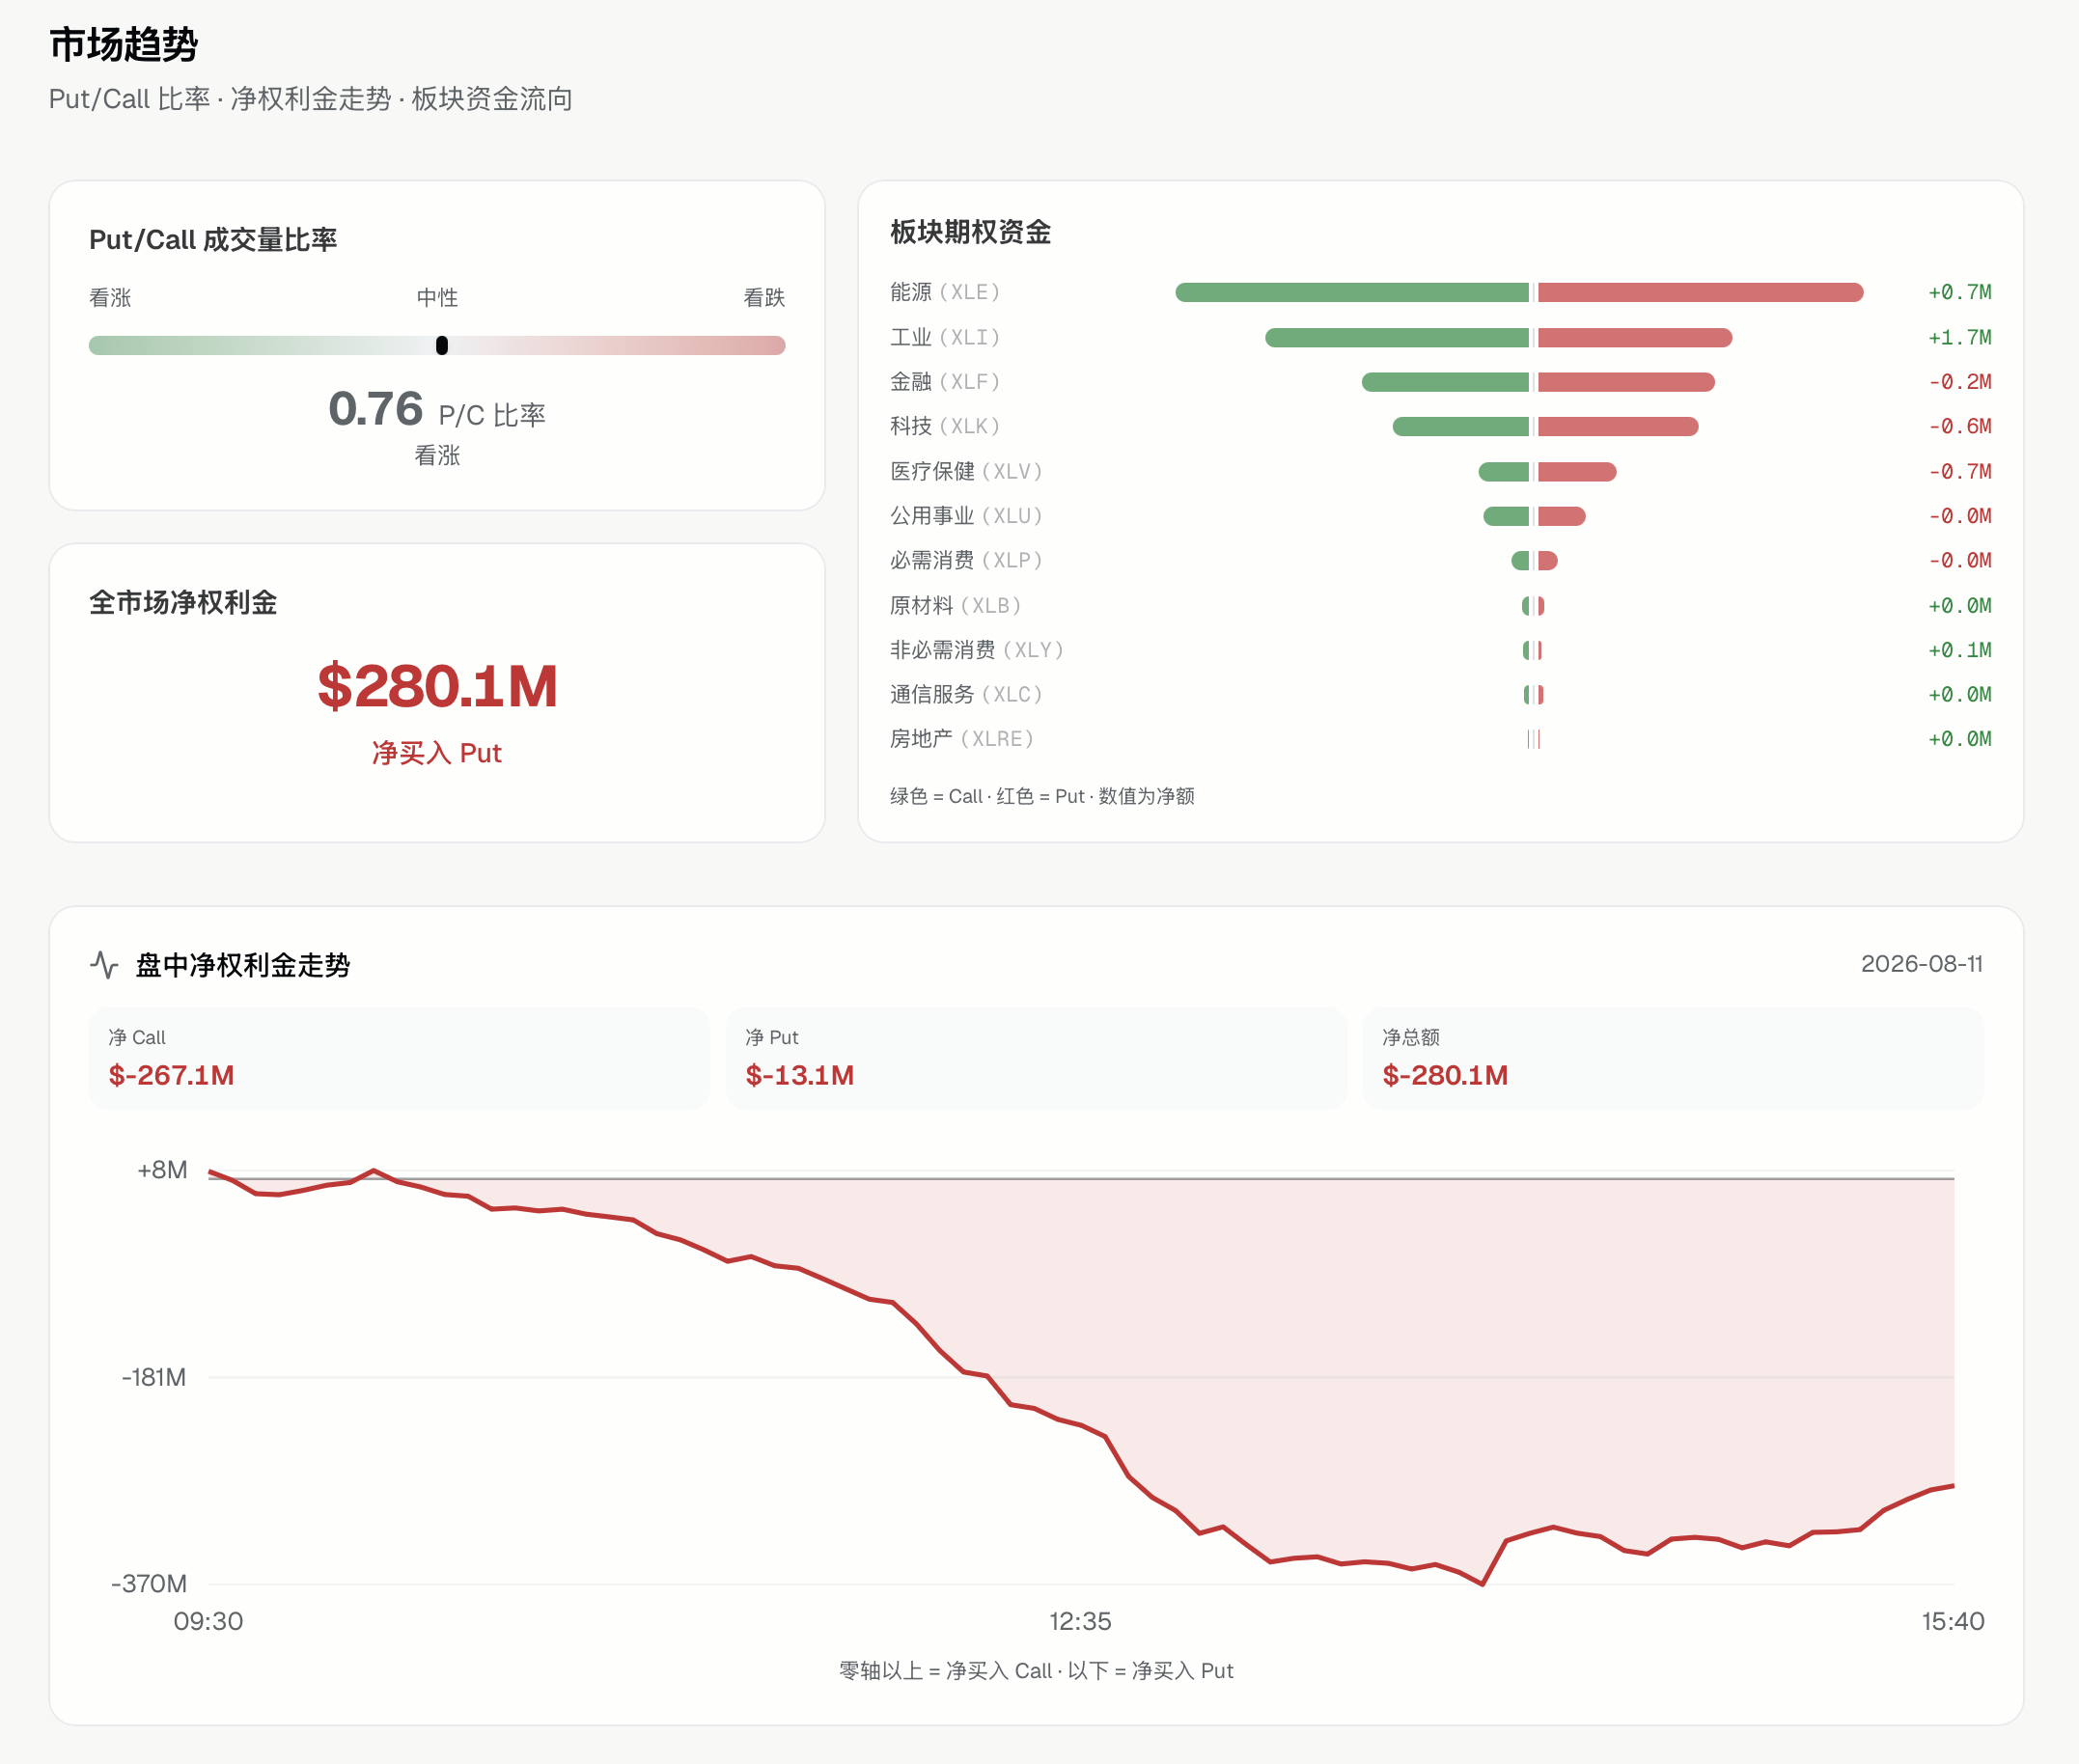
Market Tide
Before you pick a ticker
read the session's risk appetite
Put/call, net premium, and sector options flow show the day's risk appetite. Single-name structure sits on that layer.
- Market-wide put/call
- Net premium direction and intraday path
- Sector ETF capital direction
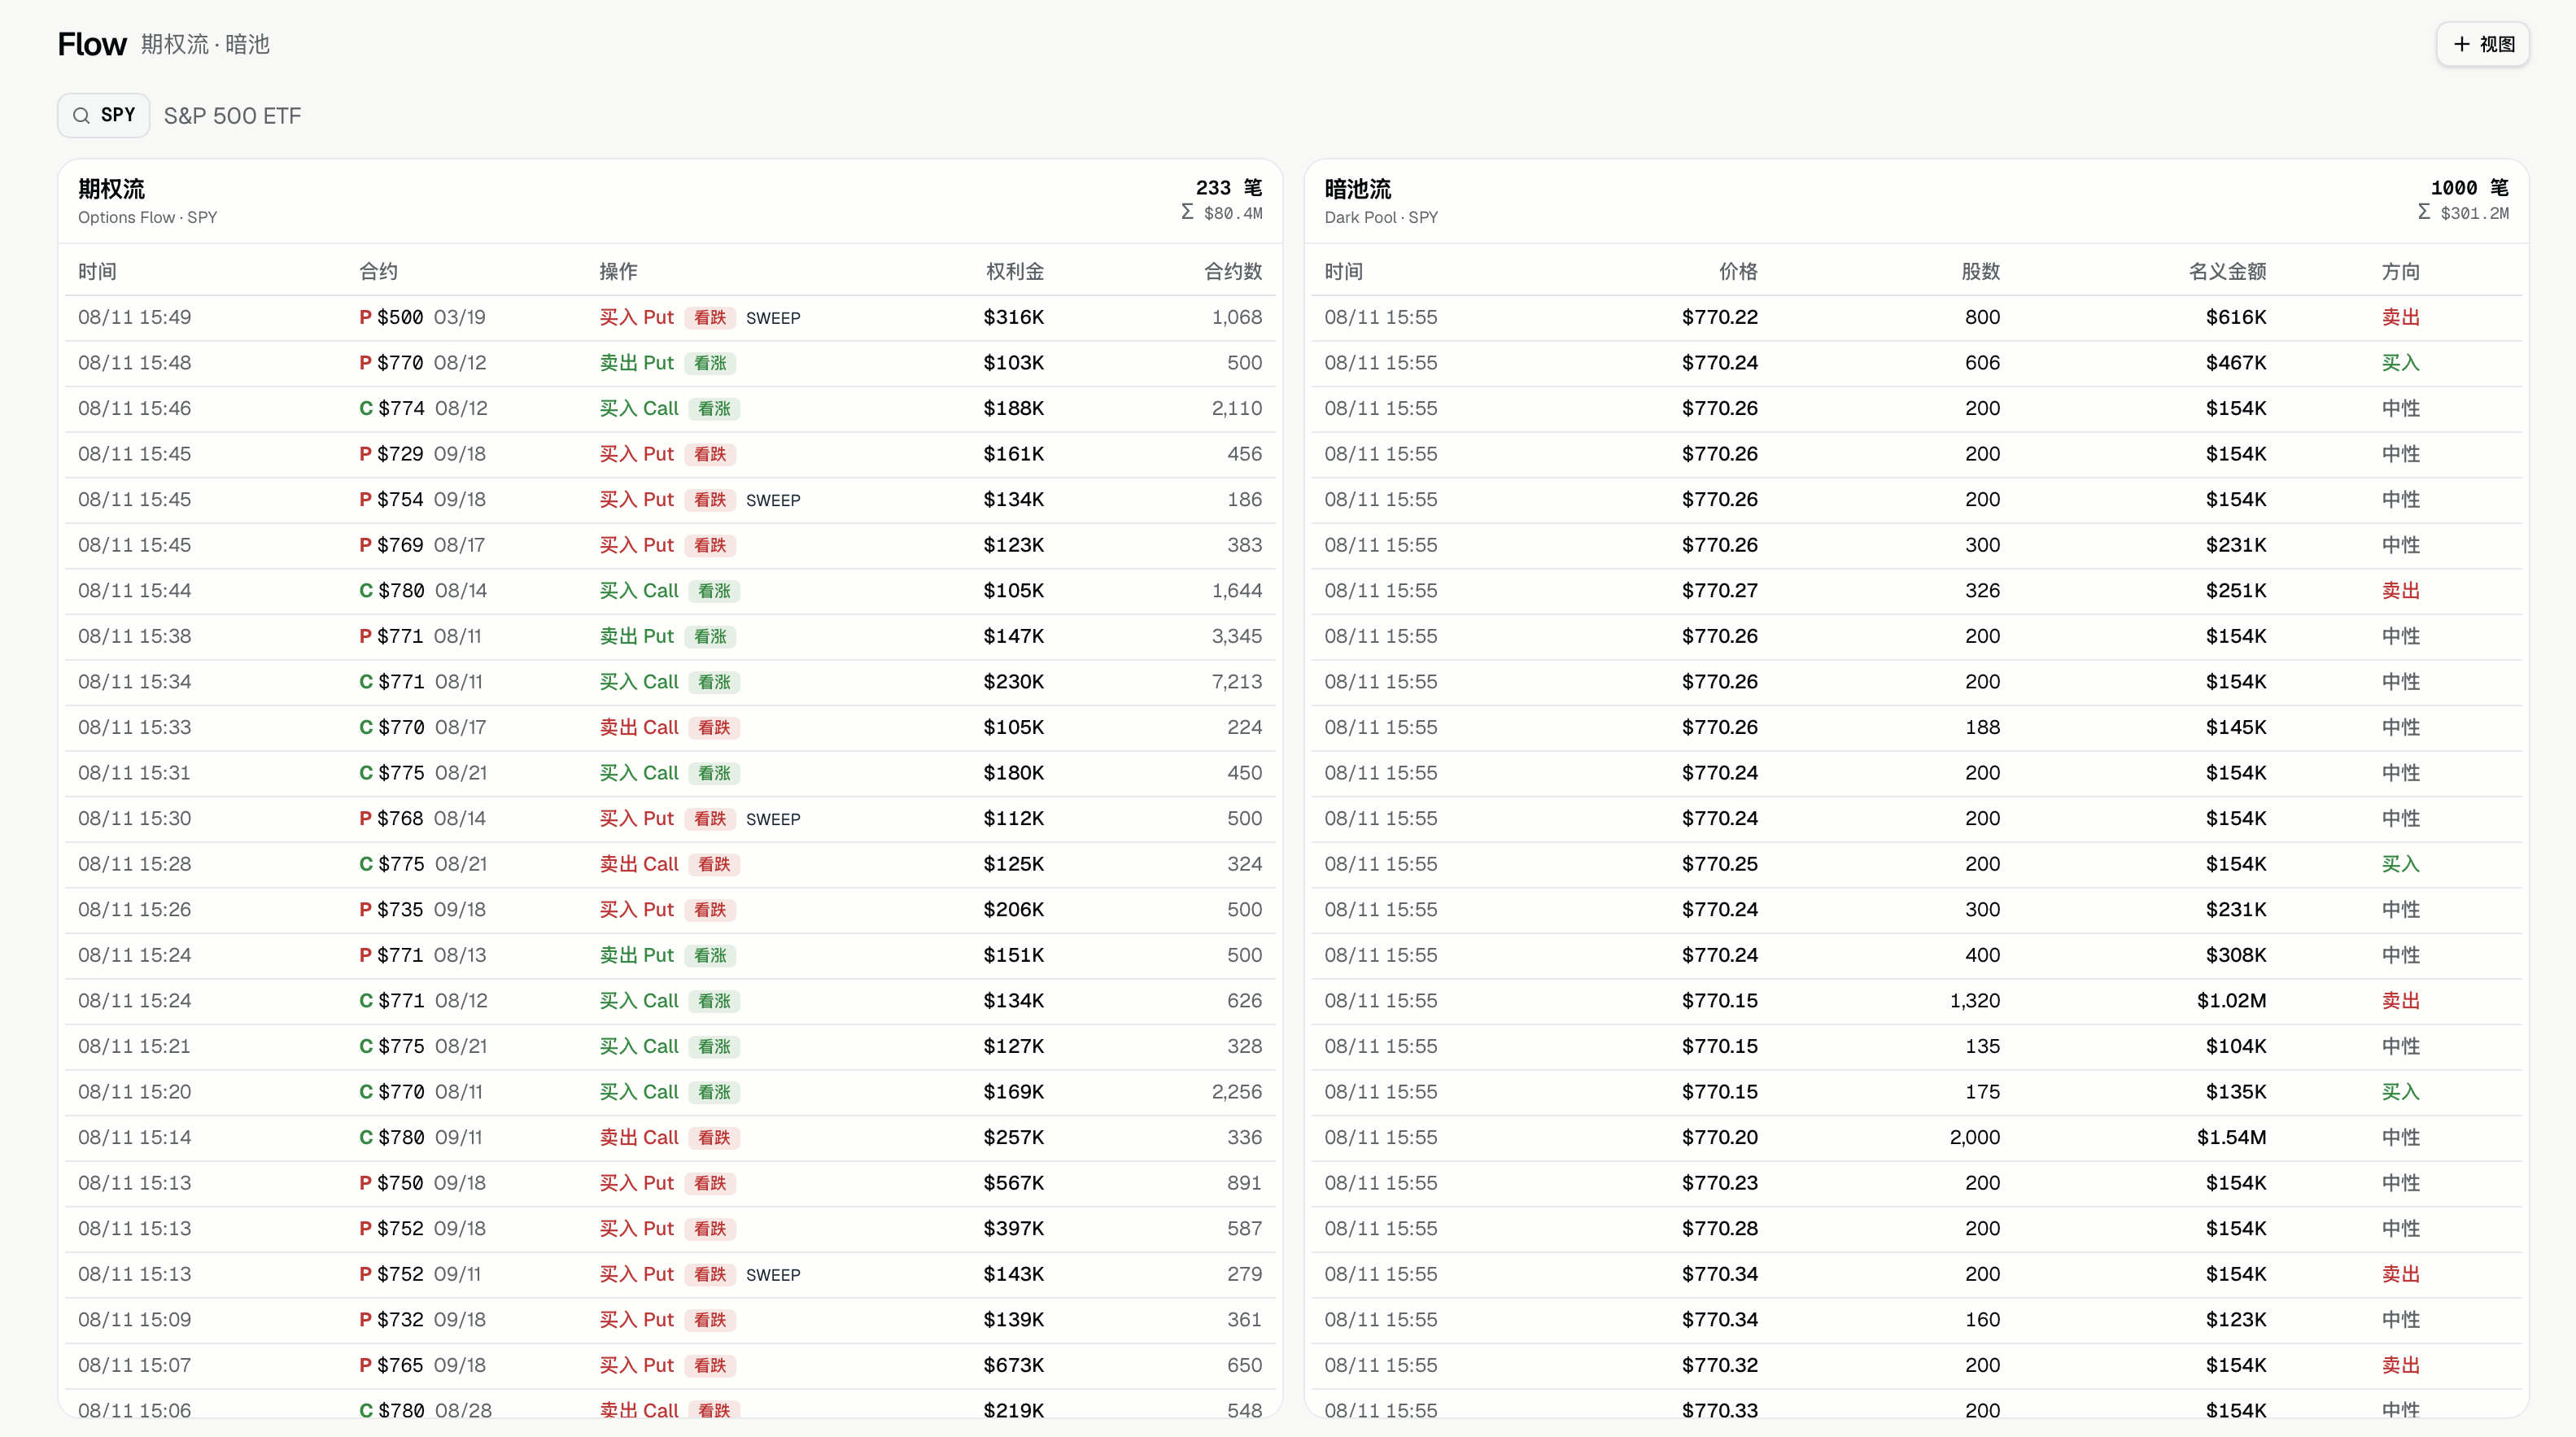
Options Flow · Dark Pool
Where large prints land
Buy/sell direction marked on each print
Unusual options and dark-pool blocks together, with buy/sell direction and notional. Open versus close cannot be inferred from the tape; use it as a structure cross-check.
- Buy / sell direction labels
- Sweeps and large prints
- Dark pool buy / sell / neutral
- Multi-ticker flow in parallel
Smart Money
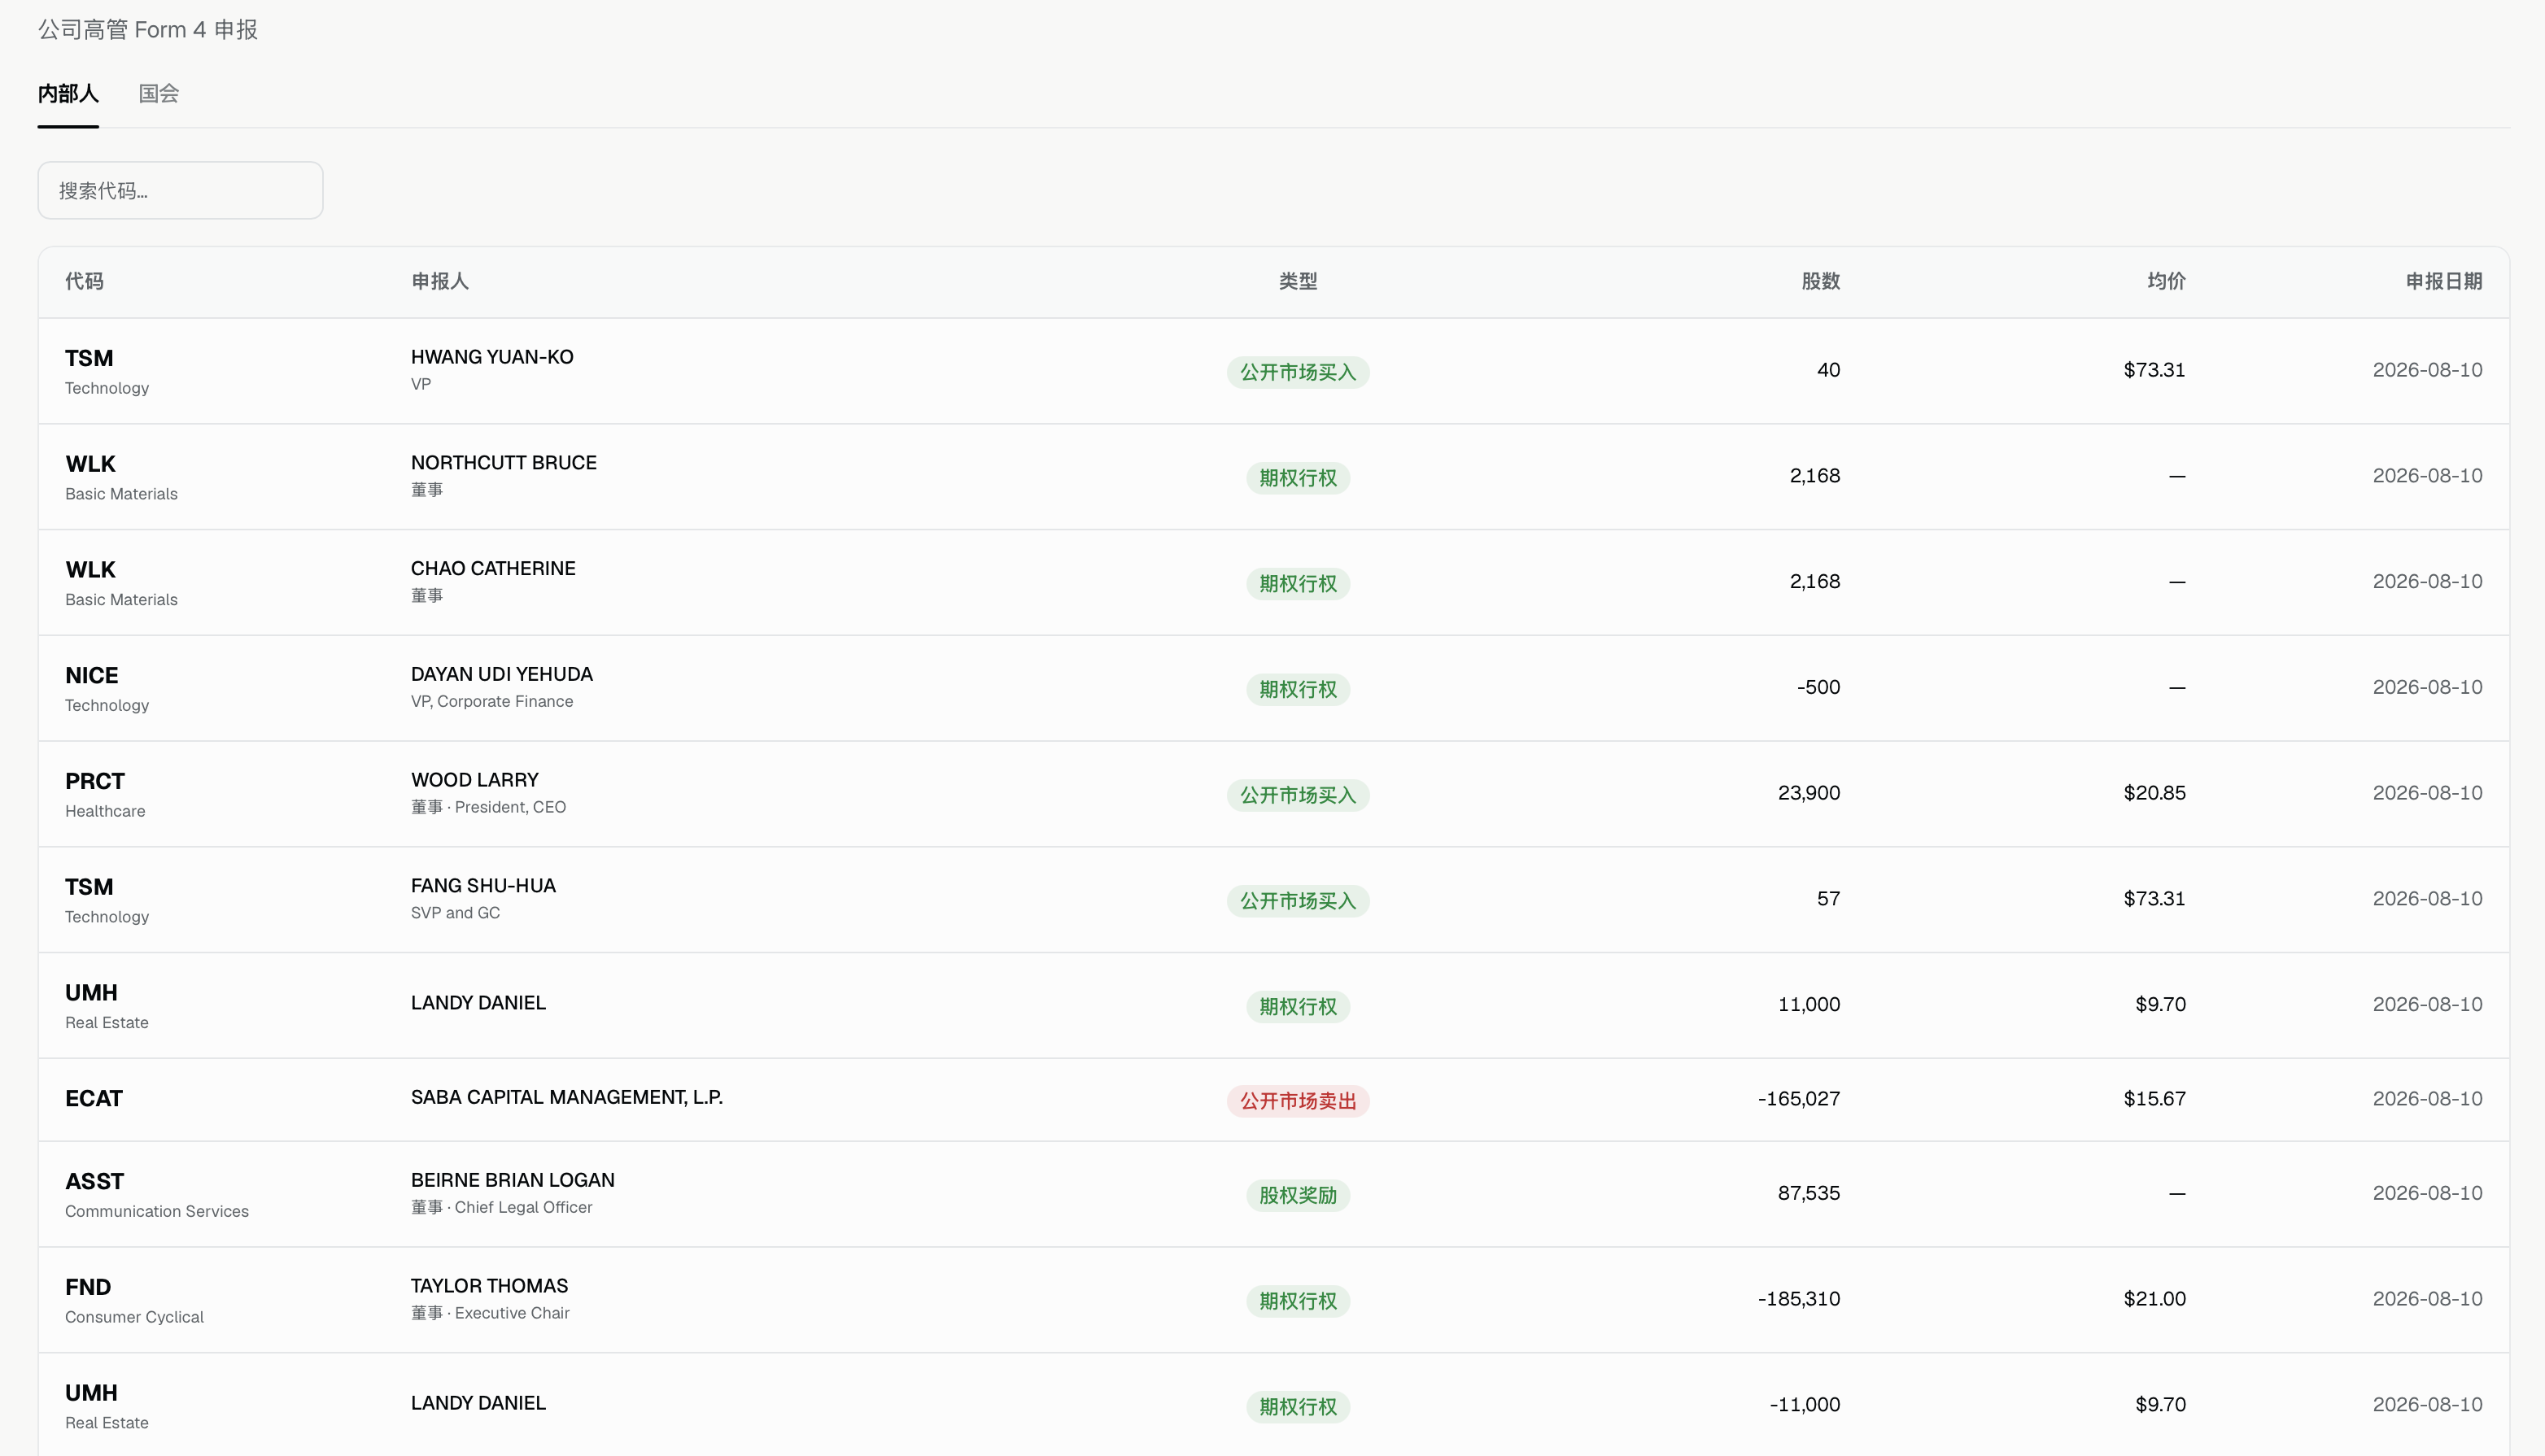
Insiders and Congress: buying or selling
Cross-check with public filings
Insider filings and congressional trades in one place, to assist judgment.
- Insider filings
- Congressional trades with ticker and size
- Search and filter by ticker
Price and structure
Same candle. The difference is structure.
After the fact
Price only
Often buying after the rally, selling after the drop.
- A rally with no key level ahead
- A drop with no way to tell pullback from breakdown
- Candle patterns give direction, not a marked level
Before you act
Structure first
Learn a method of your own, and keep the decision in your hands.
- Dealer key levels marked on the chart
- Exposure, ladder, heatmap, Delta: one read
- Market Tide, flow, and dark pool for cross-checks
Join the open beta?
Limited open beta — sign up free to explore.
Free
See the market temperature first
- Market Tide / sector flows (delayed)
- Options flow / dark pool
- Smart Money (Congress + insiders)
- Dealer flagship board
- Multi-board / multi-ticker compare
Pro
LiveDealer structure at the core
Pricing coming soon
- Market Tide / sector flows
- Options flow / dark pool
- Dealer exposure: Intraday / OI, volume / open interest
- Greek ladder: multi-Greeks · last 30 minutes
- Pro K-line overlay (with ladder / heatmap)
- GEX / VEX heatmap: expiry & strike slices
- Delta flow
- Multi-board / multi-ticker compare
- Smart Money (Congress + insiders)
FAQ
What is SmartTrace?
A US options structure platform. It takes source-market data and presents structure in institutional terms, so you see the levels first, then decide.
What is the dealer board?
It marks dealer key levels on the chart. Today: positive / negative nodes, magnet, and max pain. OI: Call Wall / Put Wall and Gamma Flip. Ladder, heatmap, and Delta share one reading method.
Free vs Pro?
During open beta, sign up for full access. After beta: Free covers Market Tide (delayed), options flow / dark pool, and smart money. Pro unlocks the full dealer board (exposure levels, ladder, heatmap, Delta) plus Add board / Compare.
Which tickers are covered?
During open beta the dealer board is live on 60+ tickers, including SPY, QQQ, and options-active names. The list will keep growing.
Is the open beta free?
Yes. Limited open beta: sign up for full access. After beta ends, accounts move to Free; subscribe to Pro for full access again.
Is this investment advice?
No. The data is for research only and is not investment advice. Judgment and risk stay with you.
Join the open beta?
Structure on the chart. The call stays yours. Limited open beta — come try it and tell us what to improve.